In a follow up to this post on the Socio-Economic Classification of Egypt's Electoral Constituencies, Mostafa El-Hoshy kindly responded to my general call for comparison between the socio-economic indicators and the actual election results. He posted his analysis on his website here.
Below are some samples of his work. Click on the images for higher resolution:
He also posts this list of seats distribution here:

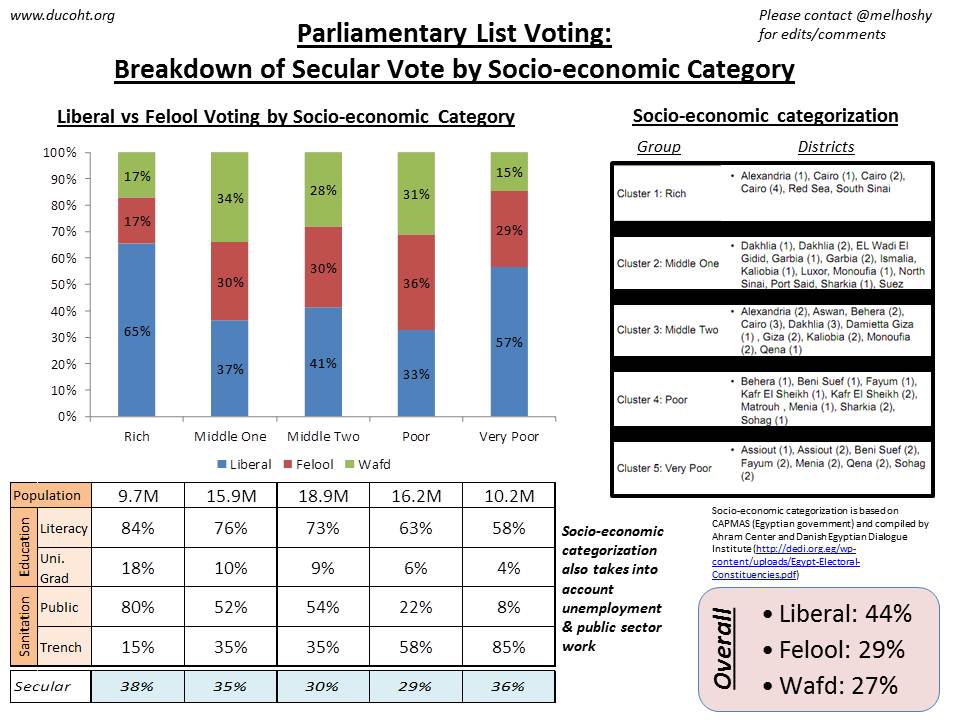
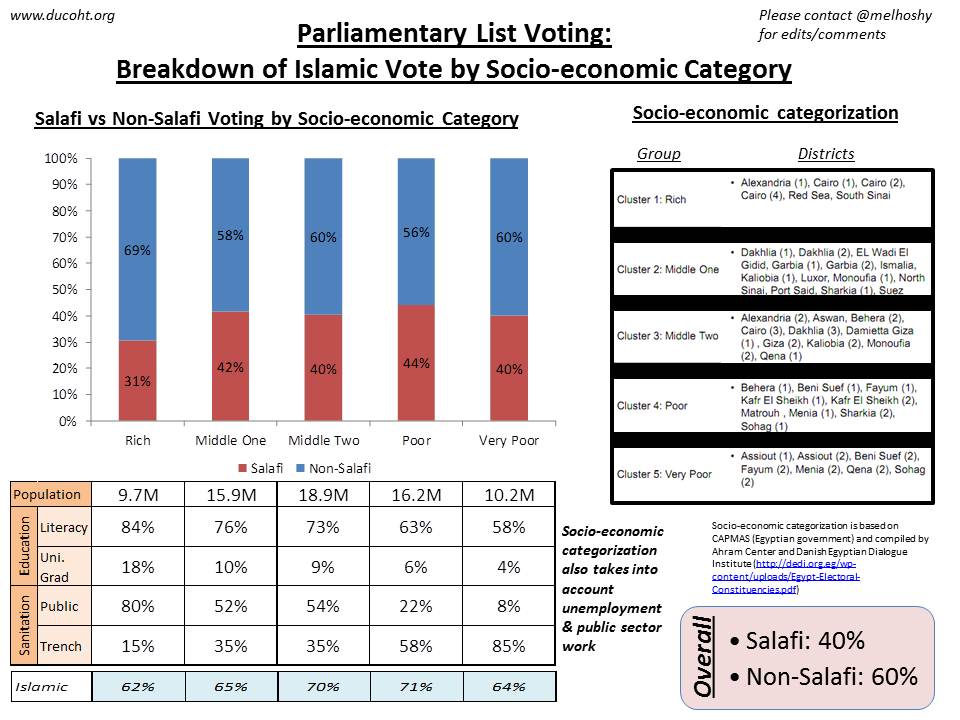
Using the five-tiered socio-economic (clusters) classification system from the Ahram and DEDI study [and they are: Rich, Middle One, Middle Two, Poor, Very Poor], Mostafa's data reveals quite a few interesting thing, assuming his analysis is correct. For example:
1- Voting for Islamists was at least at 62% of each of the 5 socio-economic strata, with the least being at the "rich" level (62%), the highest being at "poor" (71%). Oddly, the "very poor" voted 64% Islamic, on the (relatively) lower level. This shows a strong Pro-Islamists Political Current throughout the socio-economic spectrum (the reasoning is, of course, another matter entirely).
2- Same thing with the Salafis, with a consistent range of 31% (rich) to 44% (poor).
3- Mostafa also seemed to demonstrate an inverse relation between literacy and the ultra-conservative vote.
4- His data also argues that people voted for liberals over the folool, and put the total felool vote in a quasi-tie with the overall Wafd vote. Of course, the definition of who is a "folool" is hot issue, and there have been complaints that a number of political parties (liberal and otherwise) had former NDP members within their candidate lists.
There is a lot more data on the actual site. Make sure you check it out.
Be sure to also recheck the material, and update with any corrections or new info you might have.
No comments:
Post a Comment